lovela data science

Understanding the Impacts of China-US Trade War

"The United States and China have a long history of economic rivalry. But since the end of 2017, the Trump administration started to challenge China’s business activities. The U.S. began setting tariffs and other trade barriers on China to force it to make changes to what the U.S. says are unfair trade practices and intellectual property theft. All these actions have spiraled into a full-blown economic and trade war.

Though the trade war reached its end on January 15, 2020, where the two sides reached a phase one agreement, tensions between the United States and China persists and is negatively impacting not just these two countries but many others..."

Since the paper introduces interrupted time series (ITS) analysis as a practical method for event impact evaluation, we propose to study if we can apply ITS analysis to a different scenario:

The China-United States Trade War

How we achieved

To do so, we collect several different types of datasets (e.g., U.S. Trade in Goods with China, US foreign trade with product details) from WTO, OECD, the United States and China’s official website. (You can access our data source by clicking the pictures below)

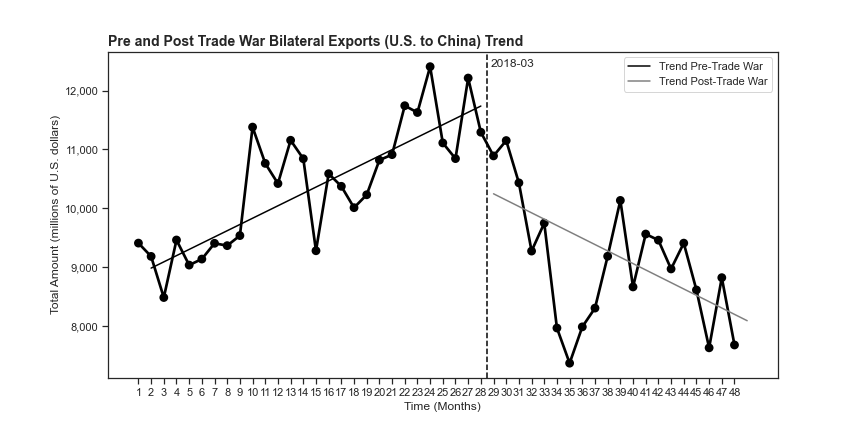
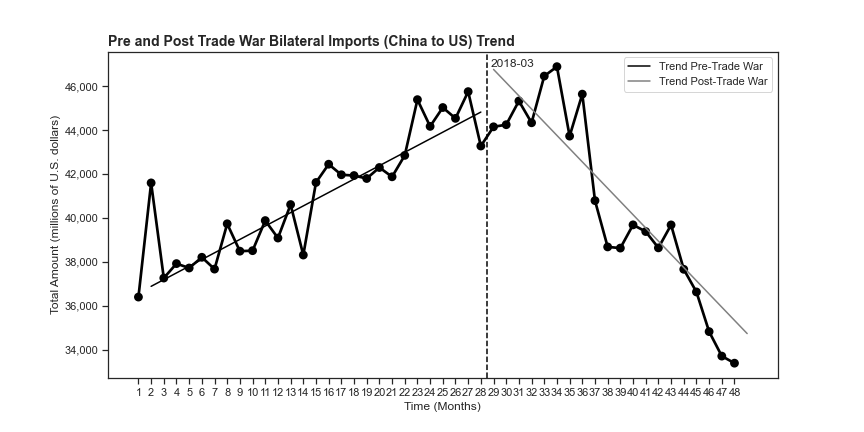
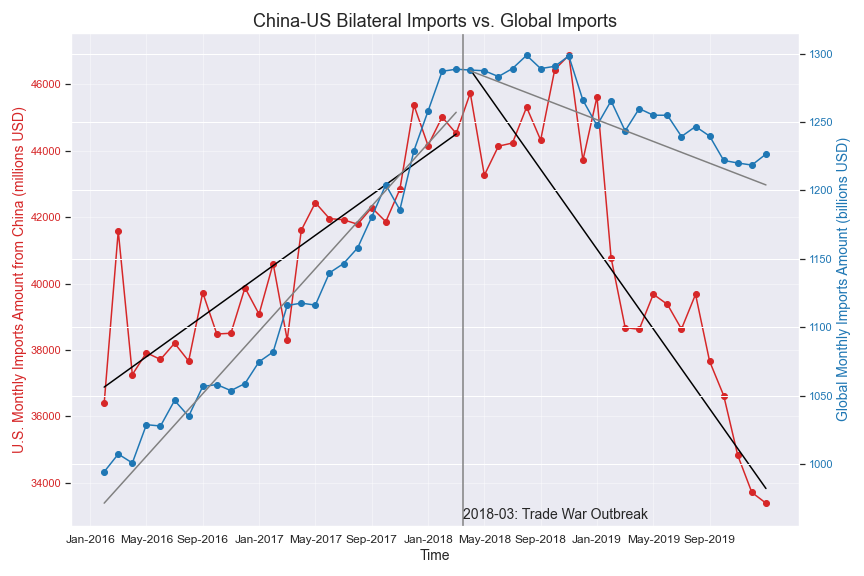
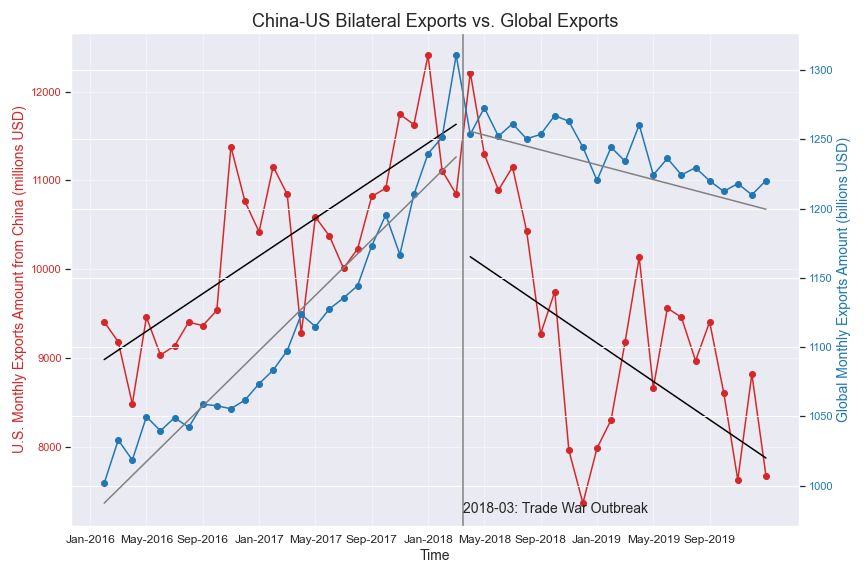
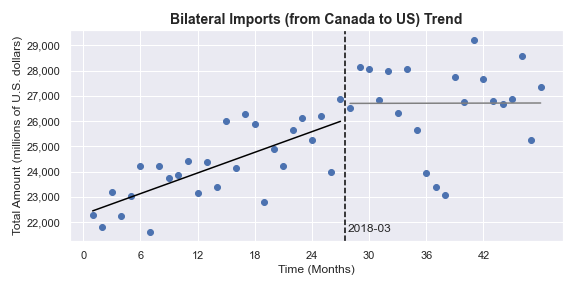
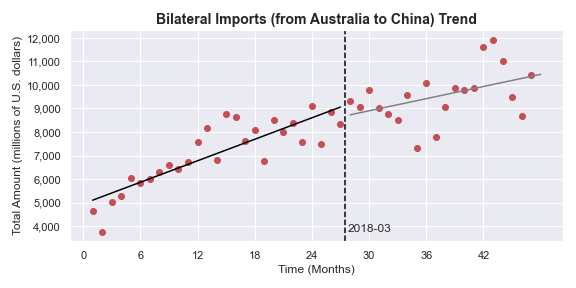
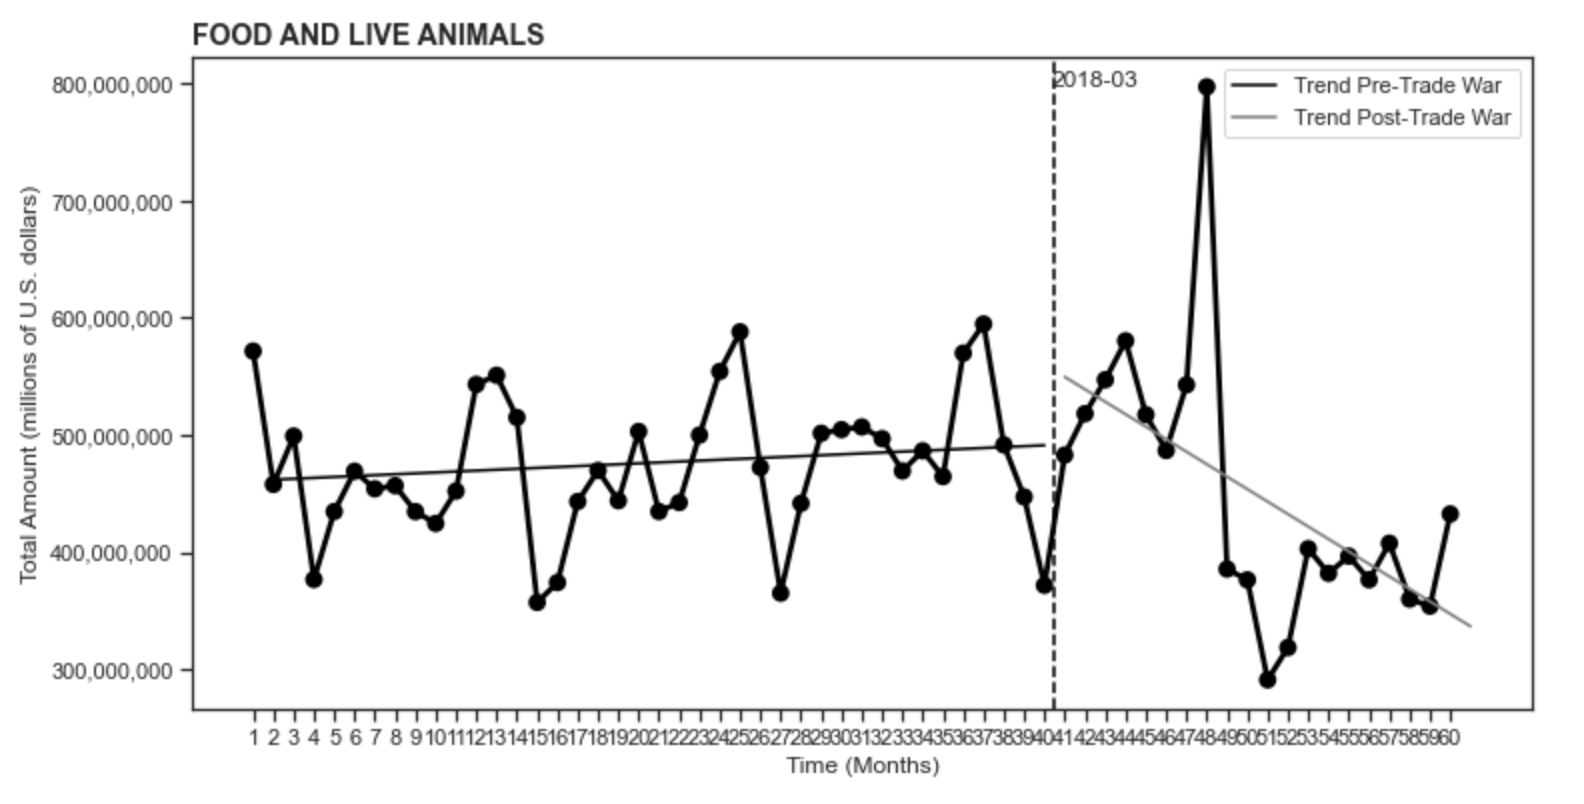
We then use ITS analysis on these datasets and see if there exists a significant impact on the China-US trade. Given that the U.S. took actions to apply tariffs on Chinese goods on March 2018 for the first time, we chose it as the trade war event intervention in our analysis. Moreover, we try to extend the ITS analysis method to better interpret multiple objects of study and other factors, including different business partners, industries, and seasonality effect. The visualization of analysis will allow us to understand the economic outcomes easily.

Our Goal

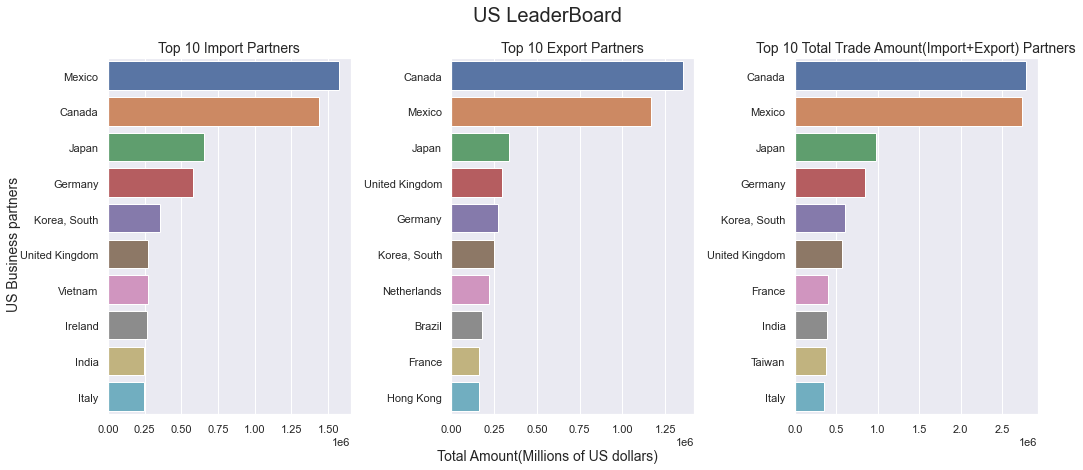
Our main goal is to find out How does the trade war affect the bilateral trade (i.e., exports, imports) between China and the US?

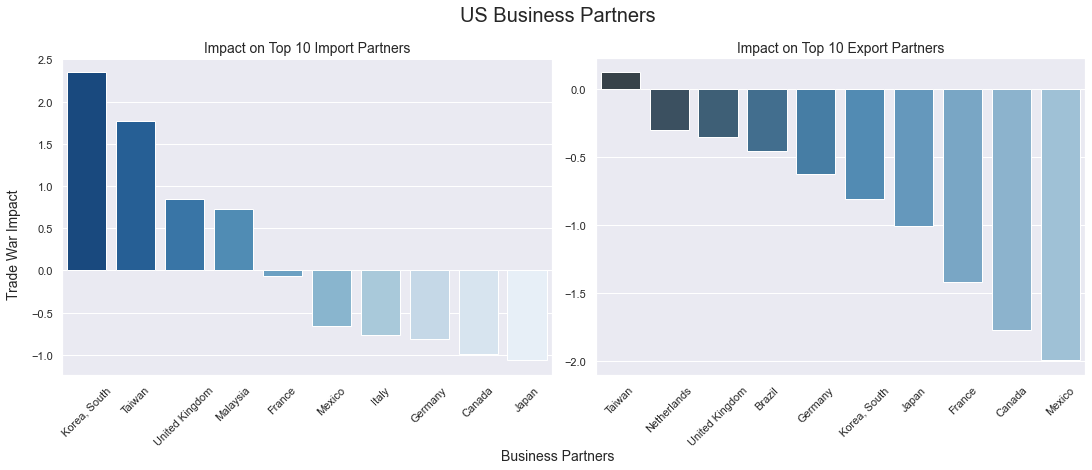
we are also interested in investigating further into other aspects of the trade war:

  • The resulting change in the trade of their business partners such as the European Union
  • Different levels of impacts in various industries

All these results would provide us with a broader and deeper understanding of the impacts of the trade war, and we would try to interpret them from different perspectives.

Data Stories begins

How does the trade war affect the China-US bilateral trade?

We first look at the data from the United States Census website by plotting the trend of the bilateral trade, from 2016 to 2020.

Given the plot, we can observe the facts:

  • US imports from China are much higher than its exports. The US trade deficit in bilateral trade is approximately 30 billion dollars per month.
  • U.S. imports from China fluctuate greatly each month and show a certain degree of cyclical characteristics.
  • In 2020, monthly trade volume has changed greatly.

Trade war outbreak analysis: Data Preprocesing

Firstly, according to the observation above, we infer that COVID-19 pandemic has greatly impacted the bilateral trade. Also, in 2020 Jan 15, U.S. President Donald Trump and China's Vice Premier Liu He signed the US–China Phase One trade deal in Washington DC. This agreement marked a phased settlement of the trade war.

According to the two factors above, we think that the trade amount in 2020 do not help to investigate the trade war's impacts because it's hard to control the variable. The pandemic may be the cause of sharp decrease in US imports but the agreement could lead to the following increasing tread. Hence, we focus our research on year 2016-2019, which is also the main period of the trade war.

Secondly, we carry out seasonality decomposition to analyze the cyclical characteristics in the trade amount. The following decomposition results indicate the significant seasonality in the trade data, especially in imports. Thus, in the final trade war outbreak analysis, we remove the seasonality to better analyze the real impact of the trade war intervention.

Trade war outbreak analysis: Segmented Regression Analysis

Finally, we can implement segmented regression analysis without considering other factors that may affect our interpretations.

First of all, from the regression results, we can see that the trade war has statistically significant impact on U.S. exports to China, both immediately and in the long term.

Before the trade war, the exports stably increase with the coefficient of time_feature is around 129.18. However, the intervetion's coefficient (-1382.35) and postslope's coefficient (-213.64), indicating that the intervention not only immediately reduced the export value, but also showed a downward trend in the next two years.

On the other hand, the result on U.S. imports from China has a certain degree of difference with the exports. We can conclude that the imports from China has both higher increasing trend before the trade war (with coefficient 304.95) and more severe downward trend (with coefficient -905.92) after the trade war. From this perspective, Chinese products are more severely impacted by the trade war.

Trade war outbreak analysis: With global trade as comparator group

To strengthen the analysis on the impact of trade-war outbreak, we select Monthly International Merchandise Trade as a comparator group. This index reflects the monthly global trade amount .

From the trend plot, we observe that the increasing trend was also slowed down in 2018 and gradually decrease in the next years. Since the global trend shares kind of similarity with China-US bilateral trade trend, we cannot directly conclude that trade-war leads to the decline in rather than global economic recession.

Given our regression analysis results, the global trade did not immediately experience the negative effects of the trade war. However, the long-term negative effect exists in the regression results, which is the similar in China-US Bilateral trade.

Does this overturn our previous conclusion in China-US Trade Trend? Not exactly, because the long-term effect is less noticeable than the impact discovered China-US trade relationships, which could be justified in the coefficient and the following plots.

Let's now see the plot below that can better reflect the difference in both the immediate/long-term impact on China-US Bilateral Trade and the International Market:

Here we can draw some conclusions for the first question, trade war effects on the bilateral trade:

Though the global economy is in a slump started from the year 2018, the impact of the U.S.- China trade war on their bilateral trade is much greater than the impact of the global economic downturn. However, is it the trade war between the U.S. and China that cause the global economic downturns or the rise in trade protectionism in this downturn leads to the trade war outbreak? The real causality is difficult to concluded by simply applying segmented regression analysis.

Despite the limitation of segmented regression analysis, we can still observe some interesting phenomenon from it:

There is a time delay in the immediate impact on Chinese exports to the US (the intervention increases rather than decreases, but then plummets after a few months) and the long-term impact is more significant than US exports to Chinese since the |postslope's coefficient| is roughly three times more than |preslope's coefficient| in Chinese exports to the US, but the |postslope's coefficient| in US exports to Chinese is only two times more than |preslope's coefficient|.

Although the U.S. presents more severe bilateral deficit in the trade with China, if we consider the imports and exports respectively, China loses more in the trade war because the difference of China's exports between pre-war and post-war reduce more than US's exports, indicating a greater loss.

What’s the change in the trade amount of China and the US with their primary business partners?

Let's focus on the next question.

Would China-US Trade War influence the trade with their primary business partners?

To understand US and China primary business partners, we fisrt give a look at US and China top business trade partners by using the data from the United States Census website and China General Administration of Customs website. Here we remove the China-US trade as we want to focus on the impact on other business partners. Then, We aggregate the trade amount for each business partner and then create three leaderboards on import, export, and total trade amount.

From the above plots, we can easily learn the US/China primary trade partners.

As we can see from the U.S. leaderboard, Canada, Mexico and Japan are the top 3 trade partners with the US in import partners, export partners and total trade amoount partners. On the other hand, Japan, Hong Kong and South Korea are the top 3 total trade amoount partners with China. Besides, most of the top10 business partners in this three leaderboard are the same but in different rankings.

We then decide to look into top 10 import partners and top 10 export partners respectively by applying segmented regression analysis.

Segmented Regression Analysis on U.S./China top 10 business partners

Similarly, just like the trade outbreak analysis, we focus our research on year 2016-2019, which is also the main period of the trade war.

We first look at the U.S. trade with its business partners.

Given the plot, we can observe that for most of the import/export partners, the total trade amount increased when the time trade war started. Also, for most of the U.S. import partner, the overall total trade amount in post-trend are higher than pre-trend.

ITS results for U.S. business partners

ITS results for China business partners

Then we turn to China's trade with its business partners.

From the import ITS plots, South Korea, Brazil, Japan and Germany have seen their total imports to China decline over time after the trade war. The rest of the world's imports have not changed much. On the other hand, we can see that exports from China to other places are not affected much by the trade war, except for India and Germany, where the export trade amount increased at the time of the incident but then declined. For all of China's export partners, the overall trade amount of exports was greater than before the trade war.

So, how can we know wich business partner has been affected by trade war the most? And which business partner has little impact? It seems hard to tell the answer straight away by looking through too many plots at the same time.

Thus, to get a deeper look on impacts between different business partners, we decide to focus on the difference between pre-trend and pos-trend trade amount on each US trade partners by using the slope coefficient provided from segmented regression analysis report.

Let's start to see who gets more impact!

From the above plot, we can easily view the trade war impact on different business partners.

For US trade partners, the trade war has more positive impact(impact>1.5) on its import partners: South Korea and Taiwan, and with slightly positive/negative impact on other business partners. On the other side, most of the US export partners has small negative impacts. By compared to other trade partners, Mexico and Canada gain more negative impacts(impact>1.5) on their trade amount.

For China import partners, South Korea has more negative impact and little positive/negative impact on other trade partners. It is interesting to see that most of China's import trade partners have negative impacts. Besides, as being China's export partners, United Kingdom and Singapore gains more influence from the trade war. The United Kingdom has more than 15 positive impact and Singapore has more than 5 positive impact. For the rest of the export partners, they receive relatively small negative impact.

To sum up, the trade war between US and China seems to not have a significant import/export trade amount impact on most of their primary business partners. Being as the main two trade partners in the world, it is less likely for other business partners to reduce their trade with the US and China.

A whole picture of US & China trade with world business partners

In order to better understand the trade relationship between other countries and the US and China, we have drawn a world map here, representing from 1996 to 2018, whether each country has more total trade amount with the US or China. (Color Blue infers that the business partners has more trade with U.S.and Red means it has more trade with China)

We can see that from the beginning, the toal trade amount with U.S. was greater than China's in almost every region. However, China rise rapidly during the next few years and become one of the top economies in the world today.

Which industry/sector has undergone the most severe decline in the trade war?

Trend: We could see approximately that the overall trend(sum over all catogories) is consistent with the result we got from before.

Proportion of each industry: For both imports and exports parts, among all the different sectors, the category Machinery and transport equipment has contributed the largest part.

For US imports to China:

The goods of kind Crude Materials, Inedible, Exept Fuels is at the second place. Especially, it has an obvious seasonal pattern of approximately 1 year and the peak always appears in October. However, we could see that the peak does not happen again in October 2019, after the trade war begins. The goods Chemicals and related products , Miscellaneous and manufactured articles and Mineral Fuels, Lubricants and Related Materialsfollow, etc...

For US exports from China:

The second most goods are Miscellaneous and manufactured articles instead. The goods Miscellaneous and manufactured articles and Manufactured Goods Classified Chiefly by Materialfollow...

And we could also observe a 1-year seasonal pattern whose peak is also always in around October for the goods Machinery and transport equipment

Segmented Regression Analysis on U.S Imports/Exports of different industries

We choose the SIC(Standard Industrial Classification) to classify the goods into 10 categories. And analysis them using ITS method respectively.

Choose imports or exports for any industry

The ITS results we got shown besides are the plots after reducing the noise as most as possible, by the method such as removing out the seasonality or removing outliers.

Special attention to the exports of catogory Beverage and Tobacco Before the trade war began, it has got a seasonal pattern and it reaches a peak at a certain time every year. But after the trade war began, the exports didn't reach a peak again at the same time in the next year. We may assume that the trade war still has had some impact on the market of Beverage and Tabacco. But Whether or not this is truly related to trade war and the reasons behind may become clear if have a longer period after trade war to study without the infection of Pandemic can be studied. Other categories such as Crude Materials, Inedibles, Except Fuels and Animal and vegetable Oils, Fats and Waxes have similar changes as well.

For the U.S imports from China, most of the catogories have been negatively affected in a long run, which can be observed by the obvious change of slope after 2018-03.

ITS results for trades in different industries

Observation of Impact on Different Industries In a Quantified Way

Click on the upper-left botton Exports/Imports to see individual sorting.

The impact is almost mutually negative for different kinds of industries for either imports or exports.

Comparing the impact over different industries, the most negative impact is on animal and vegetable oils, fats and waxes among both exports and imports, and for imports especially. The category beverages and tobacco has the least impact, for both exports and imports. The extent of impact may have relations with the elasticity of goods. For example, The goods of inelastic demand may be less impacted. The the very small impact on beverages and tobacco may be because the U.S may have other alternative trading partners, such as Brazil... Other factors, such as policy, big events, etc also accounts for this, further study can be conducted.

Comparing impact on exports and imports, the imports of the U.S is influenced more by the trade war than the exports.

Limitations: First of all, more detailed classification of goods can be taken into consideration, such as the catogories of goods within the advanced-technical products are worth studying. Besides, we could also study the change of trades with other partner countries for a certain industry, in order to better understand its extent of impact.

Conclusion

We mainly used interrupted time series (ITS) analysis to answer our question: to what extent has the US-China trade war affected the exports and imports trades of these two countries? By splitting the time period into two segments before and after the trade-war began and study the linear regression respectively, we observe statistically obvious long-run impact. (indicated from the decrease in slope). Introduing the control group, we have concluded that although this decrease is not fully influenced by the trade war, it does contribute a large part.

Moreover, we look further into details: the impact on different trade partners of the U.S and China, as well as the impact on different industries. And we get some interesting observations: the impact on other trading partners some are negative and some are positive. For almost every industry the impact is negative.

Generally speaking, China and the U.S as two large economies in the world, the trade between them has indeed limited their bilateral trades and may even does harm to the global economy. For further study, more economic and social implications is expected. And the result may become more precise if we extend the time period and could get more data in the future. Relations of trading partners in specific industry can be conducted to understand the impact. Apart from this, the impact on other aspects, such as cultural communication, social status as well as trades are also worth researching.